An information graphic or infographic is a graphic visual representation of information, data or knowledge that is intended to present and convey information as quickly and as clearly as possible. The use of infographics can improve cognition and memory by utilising the mixture of graphics and text to enhance the human visual system’s ability to see patterns and trends.
Infographics is an easy way to grab the attention of short attention spanned viewers who prefer to consume ideas and knowledge that are graphically represented, and along with it’s adaptability to all forms of new communication channels – the shareable and reusable use of infographics is ideal to broadcast all types of information.
Infographics: uses and benefits
- Graphics are attractive and are easy to consume
Infographics that are attractive, have compelling content and are easy to consume, are usually guaranteed to be shared and have viral capabilities.
- Attractive – colour schemes that are fitting to the idea being portrayed, images that are suitable and fonts that are easy to read.
- Compelling – content that catches attention and can be associated with.
- Easy to consume – clear, concise text that is easy to read and is summarised to convey the main idea.
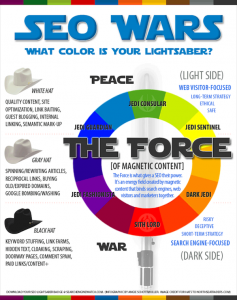
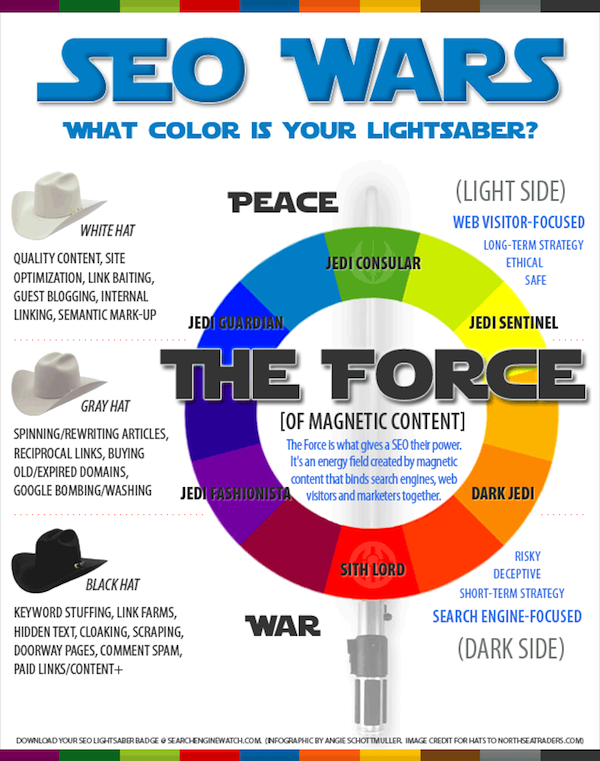
Infographic sourced from Search Engine Watch
- Social media
It is proven that viewers love stats, figures and statistics and along with compelling and attractive imagery they will melt at the idea of something that is easy to scan and view. Infographics also have the ability to be adaptable to all forms of communication platforms and with the use of internet and social media, well done infographics have the potential to reach millions and in doing so create brand awareness and increase traffic to your site by the countless likes, shares, mentions and retweets.
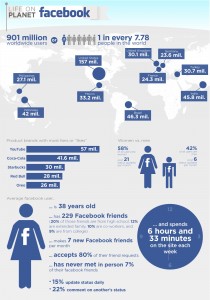
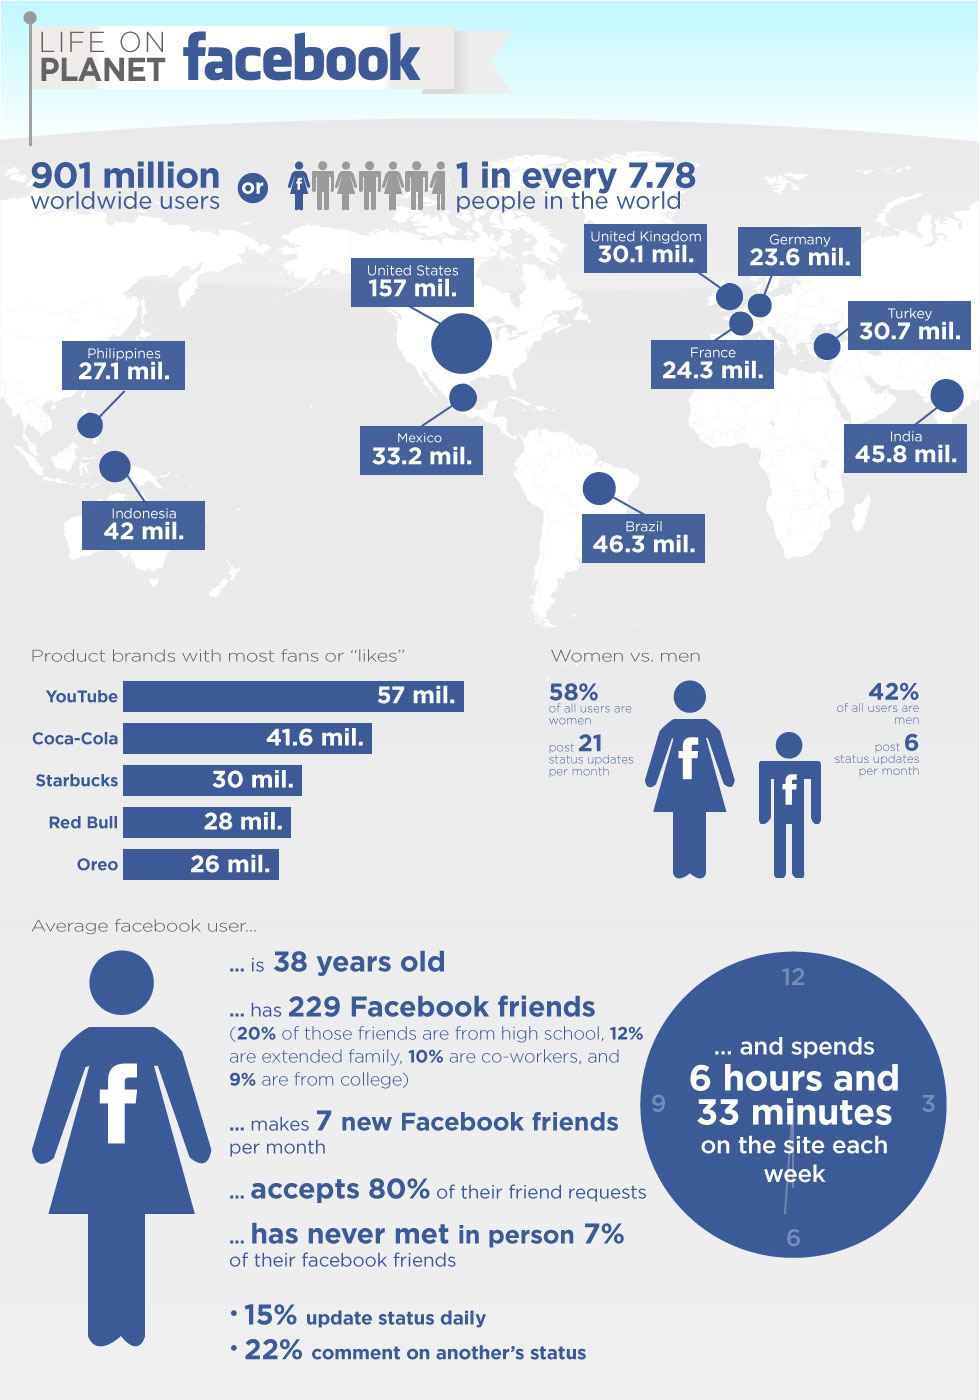
Infographic sourced from CNN
- Comparisons
Infographics are ideal for drawing comparisons to help organise similarities and differences by creating a visual representative piece. Presenting an infographic that is neatly arranged, visually appealing and is easy to decipher, comparisons become clearer. A comparative infographic is easy to consume and compares ‘apples with apples’ which ultimately shows credibility and expertise in a specific field and the best part about it all is that it can be easily shared and reused at anytime.
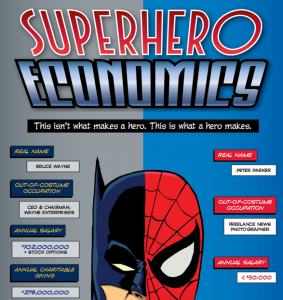
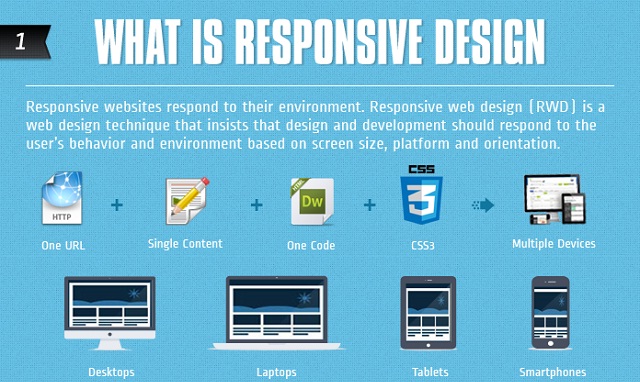
Infographic sourced from Athenna - Simplify a complicated concept
The main idea behind an infographic is to simplify a complex idea. This provides the viewer with a great educational tool, especially when presenting an overview of a topic instead of an in-depth analysis. The simplification as with comparisons portrays an expert understanding of the idea and is best presented in a terms that are easily understandable and not too technical.

Infographic sourced from Visualistan
- Inform consumers
Consumers prefer to make informed decisions based on facts and statistics, so that they can be assured that they are spending their money on something that fits their needs. Along with the capability to inform consumers it can also raise awareness and interesting facts about the topic at hand.
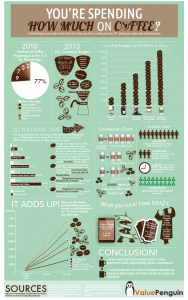
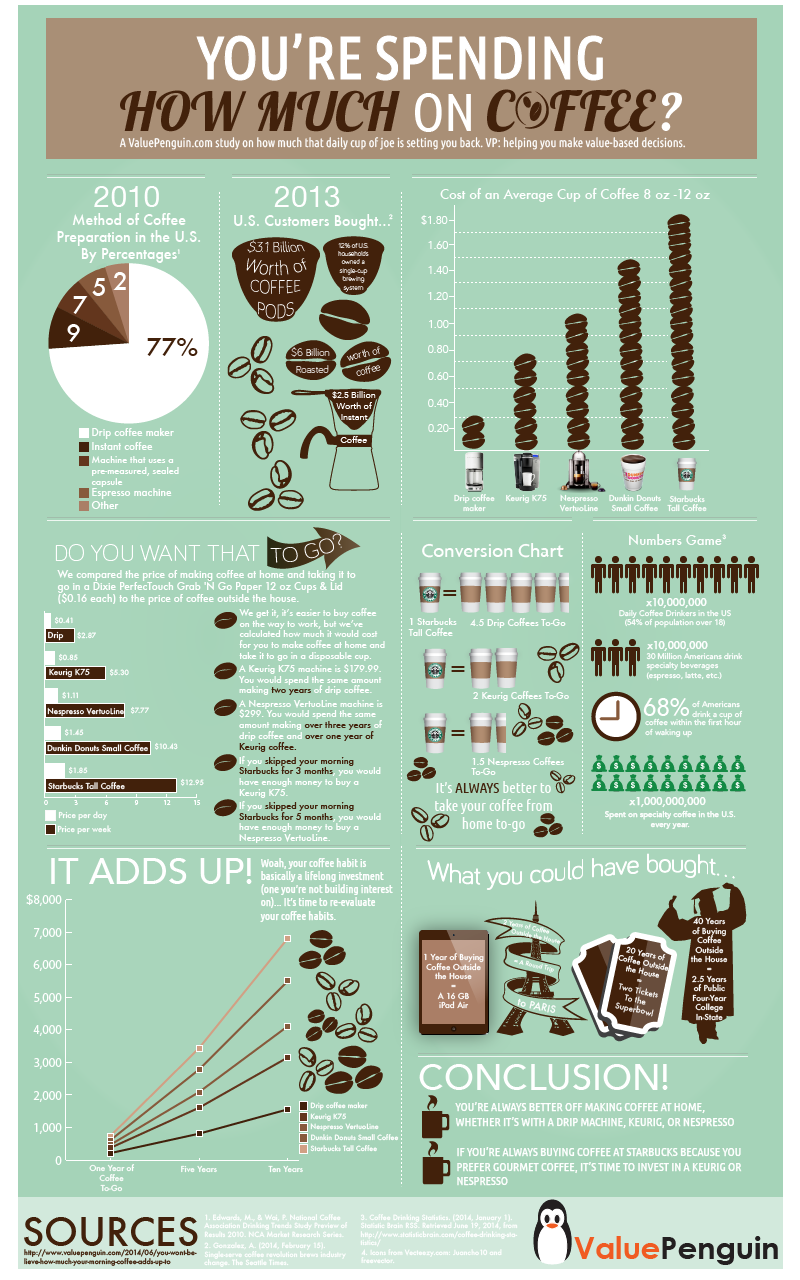
Infographic sourced from Value Penguin